The next six weeks will be risky for all of us as the Covid-19 epidemic continues to extend its reach. Nevertheless, I am convinced we can all stay safe with a high degree of probability during this time, whether by keeping in our circles of safety, or by careful use of personal protective gear, providing we are rigorous in our self-protection.
I also believe the published daily data on the number of confirmed new cases, total cases to date, and numbers of deaths from SARS-CoV-2, the virus that causes Covid-19, provide an incomplete picture of the extent and seriousness of this epidemic. I will try to present the incidence data in a way that I believe is more explanatory of what we are all experiencing, and as well to explain why I worry about the next two months especially.
Staying safe with personal distancing and PPE
I want to apologize for spending less time on personal protection for everyone who needs to go into the world, or who wants to, compared to staying sealed in a circle of safety without venturing out. Let me review.
Careful handwashing is the mainstay of protection, so that any virus picked up by touch from surfaces does not get to our respiratory tract. The CDC has been encouraging, if a bit belatedly, that face masks, including cloth masks that cover the nose, mouth and chin, do have efficacy in blocking ambient respiratory droplets from others that may contain the virus, especially in public settings where people maintain physical distance of at least 6 feet and don’t linger in enclosed spaces. More effective face masks and face shields are needed in close medical circumstances especially working with infected patients, but cloth face masks, handwashing and active distancing appear to be effective in supermarket and pharmacy protection, for example. Face masks worn by everyone eventually should enhance our mutual protection.
Gloves likely are not that much additional help in store situations, providing one avoids touching one’s face, and washes carefully after unloading at home. If antiseptic wipes are available, they are of some additional help for wiping down door handles and car steering wheels, but prompt handwashing works well at home.
As to circles of safety, they appear to be working for all our members who hold to them. We urge you to keep within your circle exclusively at least until the end of April. Dr. Sobel and I both are concerned that there are too many unknown unknowns potentially afoot during the greatly increased Covid-19 prevalence this month to consider merging previously unconnected but secure circles of safety. That likely will be possible in May. For now, we would really be reticent to do any mergers.
How many people have Covid-19 now?
Massachusetts DPH publishes daily case numbers, which really is the “incidence” of the documented disease cases. Actual cases are higher, but to an uncertain degree because of still limited (though slightly more available) PCR testing. The duration of each medical case is approximately three weeks according to CDC descriptions, from the start of symptoms through two weeks of recovery and a week of convalescence. Recovery time may actually be longer in many cases, but 3 weeks is in the range.
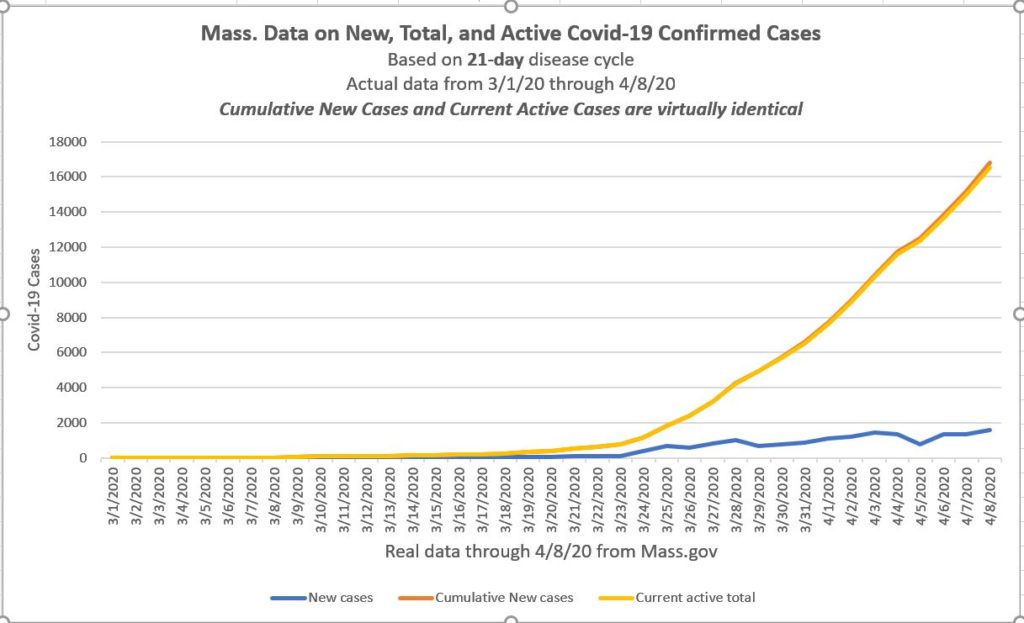
So the actual number of people with the disease at any time, the current active patients officially called the prevalence, can be estimated from the number of documented new cases in the prior 3 weeks. I have done so. In the first graph, we see the number of new cases, the total cases to date, and the prevalence data (current active cases) showing how many people likely had the documented disease on any day up through yesterday, April 8. Given there were so few Massachusetts cases before March 18 (3 weeks ago), the graphs of cumulative new cases and current active patients (prevalence) essentially overlap :
Cases continue to increase daily in Mass.
While the daily new case count continues to rise, there is some indication that the rate of increase of new cases in slowing slightly, though not yet near a plateau nor an actual decrease. Yesterday’s new cases on April 8 numbered 1588 compared to 1118 on April 1 — 470 new cases or a 42% increase in one week (or 6%/day). The prior week, from March 26 to April 1, saw cases rise by 539 or 93%. So the rate of increase of new infections may be diminishing, which is good news, but it has yet to plateau (such as 1588 cases on 4/1 and 1592 on 4/8) nor to decrease.
Where are we heading in this epidemic?
Many of us, I believe, are not numerically clear about what is being forecast for a “surge” or a “peak” in Covid-19 cases and why public professionals are talking about such a potentially long time till normalcy. I will try to illustrate an optimistic case for disease progression and turn toward normalization, based on the Massachusetts Covid-19 numbers to date from the first graph as a starting point.
I think fairly optimistic assumptions might be as follows:
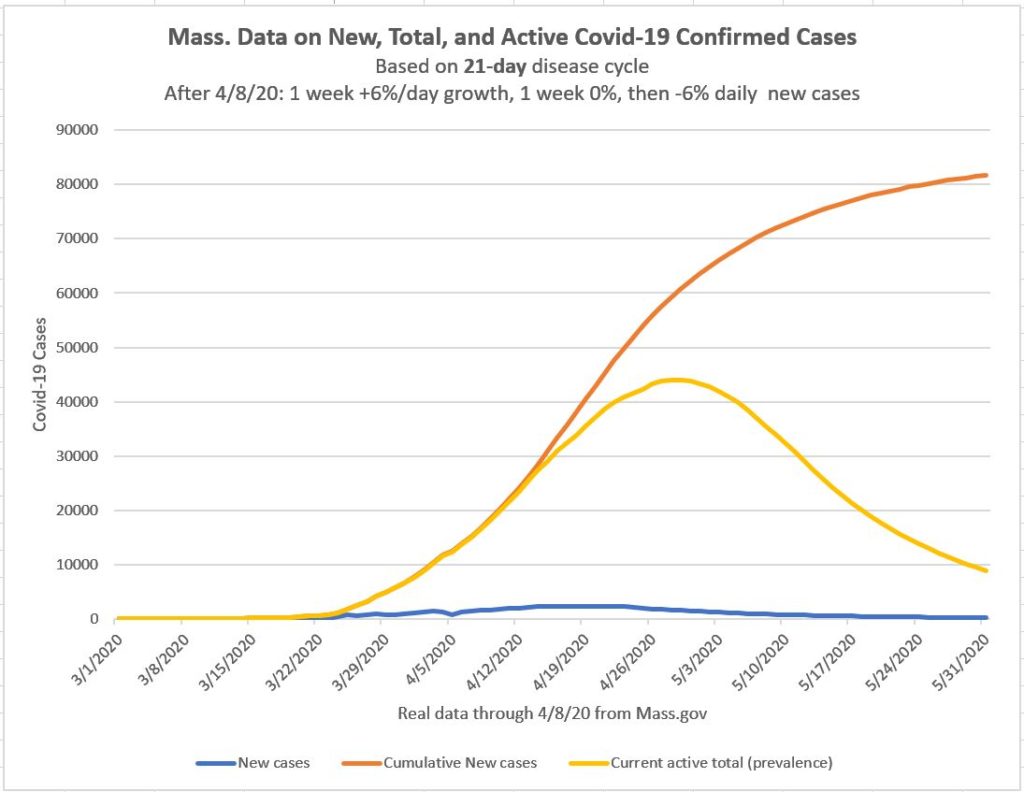
- The disease continues to cause new cases increasing by 6% daily for one week, the same as last week’s rate.
- In the second week, the infections do plateau, meaning the new cases per day remain the same (rate of increase is 0%).
- In the third and subsequent weeks the rate of new infections starts to fall by 6% daily, the mirror of the past week’s increase.
My additional assumptions include:
- 21 days remains a realistic representation of the duration of the typical Covid-19 case.
- No truly effective treatment is found and distributed in the next two to three months.
- What we really want to know is the prevalence, or the number of active cases, because that number indicates how many people around us or in the community are infected at a given time, and that should well correlate with the intensity of the community risk (though clearly the undiagnosed and asymptomatic carriers of Covid are an important part of the story, though hard to quantify).
In the following graph, I show how this scenario plays out:
What do we see?
The most important conclusion I would take from the this analysis and graph is that we will see a tripling of the number of active cases in the community from 15,000 or so now to about 44,000 at the peak on April 28, and that we will not return to the same level of community disease as we have now until about May 20. That is one of the manifestations of the “surge” and carries with it many more ill and sometimes very ill people.
That’s almost six weeks. We will be concerned about Covid-19, keeping safe, and at the same time trying to get back to more normal work for a long time. When will we be able to get a professional haircut? Or eat in at a restaurant?
A quick final note on this model. I am not trying to preempt or challenge the vastly more complex modeling being done by epidemiology and related specialists with much more detailed data who can incorporate the changing infection rates and other variables as we move forward. Perhaps the true disease cycle is best estimated at 18 days not 21 days. That will lower the peak of the curve and make it occur slightly sooner. Or perhaps physical distancing will be successful in more rapidly reducing the rates of growth of new infections, in which case the outcomes can be better still.
I do hope, however, that this brief (not so brief, actually) example exposition and graphs will help you better understand what we all will be facing and why as April marches on and turns into May.
And I truly hope the spring will really be beautiful to keep us all cheered up as much as possible.


Thank you Steve.Seeing the visual graphing was particularly helpful.
I am pleased. I also find clear graphs to be really useful in just this sort of quantitative discussion.
Good, clear discussion Steve, I learned the term “prevalence” which, despite keeping up fanatically with the COVID-19 science, I had not heard before in this context.
Thanks for a great blog. Keep it up! Looks like you have done this for a long time.
Jim, glad to hear from you. Prevalence is the medically correct term for current presence of a condition. Incidence in a time period is the rate of new occurrences. Greater prevalence of an infectious disease begets more contacts and usually a higher incidence going forward hence the “surge” which is growing and which I showed graphically.
With all the news and mixed opinions is nice to have your update , it really puts things into perspective. Thanks so much for taking the time to keep us informed in a simple language to understand .
I am glad our posts are useful. We are trying to explain sometimes complex issues as simply and clearly as we can.
Thanks for the analysis. The problem I have is that everyone is using total numbers, it even county by county numbers for these analyses. What you don’t address is that the number of infections and the associated risk is hugely different if you live in Boston or Cambridge vs Lincoln or Carlisle or Westford. Yet, Cambridge and Lincoln and Carlisle and Westford are all in Middlesex county so even at the finest granularity that’s being measured there are huge differences.
It seems to me that with reasonable precautions we could much more quickly open businesses and schools and such out here in the ‘burbs as long as people don’t travel into the “city” and don’t associate with people from the city.
Also, the way we’ve implemented this “shutdown” is completely nuts. As an example, the auto parts store in Acton is open so you can fix your car, but the garage I sometimes use, directly across the street, is closed. The shop has 3 employees. There are so many similar instances.
There’s now a CVS in Lowell doing 1,000 immediate drive through tests a day, and I’m sure more are coming. Shouldn’t we be looking at getting life going out here while the urban areas will need more time?
Andy, I agree fully about the differences among different geographic areas, largely as a function of density. This post was done with current aggregate data from our state to illustrate the prevalence issue as clearly as possible. In a subsequent post I will try to delve into the real differences in risk and prevalence in, say, Boston compared to Carlisle and how that might affect strategies to get back to normal activities. But we will not get very far in any rational plan that wouldn’t include Covid-19 antibody testing for large portions of the population, at a minimum. I’d also agree the safety goal is not perfection, but it’s hard not to worry about breakthrough infections when there is no documented specific treatment.
I think that one of the important ways that masks help is to serve as a reminder to keep my hands off my face. Even a poor mask helps a lot with that.
Yes. Masks help and not scratching your nose is unreasonably important.
Excellent summary. Thank you.
Stay well in Florida.
Information was most helpful. I like so many others look forward to beginning a new normal. Stay safe
New normal will be different. How to include restaurants in this new world will be tricky.